
Introduction
Hockey, a sport consisting of two teams of five skaters and a goalie on ice, is a dynamic blend of tactics and physical skill. In today’s era of advanced analytics, the way teams, athletes, and fans understand hockey is changing rapidly. Predicting player performance, optimizing team strategies, and improving fan experience are prioritized by many smart minds in the sport. Using statistics, advanced analytics, and machine learning, we can uncover hidden patterns in the action and drive the evolution of hockey into a new generation.
Advanced Analytics
Beyond fundamental hockey metrics like goals and assists, “advanced” analytics are growing in popularity. It is important to understand these key metrics.
Corsi and Fenwick
Corsi can be explained as shot attempts. This includes the sum of shots on goal, missed shots, and blocked shots. It can be measured for a team or a player. Most commonly, Corsi is used to approximate shot attempt differential, which can be used as an indication of future goal differentials. If a team or player has high Corsi, they are creating more chances than their opponents, which should result in a higher goal differential over time. Most players have a “Corsi For” percentage (percent of shots for their team, compared to their opponent) between 40 and 60. A player or team ranked above 55% is often considered elite [1].
Fenwick, also known as “unblocked shot attempts”, is a variant of Corsi that only counts shots on goal and missed shots; it does not include blocked shots. It is generally viewed as having a stronger correlation to scoring chances. By itself, it is less reliable than Corsi, but it is the foundation of most Expected Goals models, which will be explained later [1].
PDO
Simply, PDO is the sum of a team’s shooting percentage (offensifve goals scored divided by total shots for) and save percentage (shots saved divided by total shots against), multiplied by 10. Most teams should expect a PDO of around 100. PDO is often viewed as a measure of how “lucky” a team is [2]. For example, if a team has more goals scored on fewer shots, this could be interpreted as the team getting lucky with these goals; their shooting percentage would increase, resulting in a PDO greater than 100, reflecting this luck.
Expected Goals
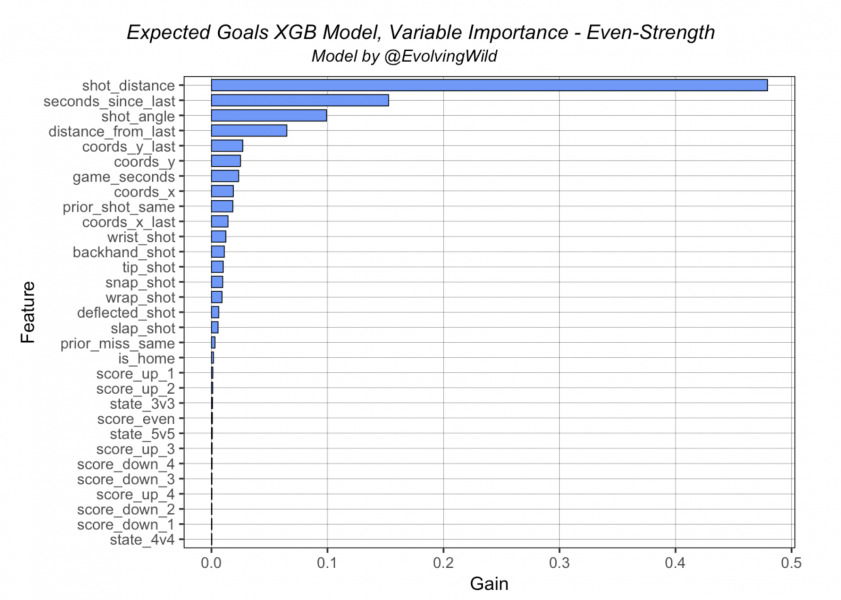
Expected goals, abbreviated as xG, is an attempt to give each shot attempt value, depending on its location and type [3]. For example, a shot from the front of the net might get a score of 0.3, whereas a shot from the blueline might only get a score of 0.02. Generally, models will also factor in the situation of the game, such as if the shot is off a rebound or a rush [4]. Essentially, xG can be viewed as a form of Corsi that values each shot differently. This is not an exact science, and there are many different xG models, such as the model from Evolving Hockey [5]. The variable importances in Figure 1 show how each shot is measured for its contribution of the expected goals score.
Goals Saved Above Expected
Goals Saved Above Expected can be interpreted as the goalie version of expected goals. This is calculated as the expected goals against minus the actual number of goals the goalie has let in. A positive number means the goalie is stopping more goals than an average goalie would [6].
Wins Above Replacement
Wins Above Replacement (WAR) is another metric with multiple modelling approaches. WAR attempts to assign a total value to each player to represent how much that player contributed to their team [7].
Applications of Advanced Analytics
Many of the advanced analytics metrics described above are used for player evaluation. Individual metrics, such as Corsi, Fenwick, and WAR, can be used to evaluate a player’s value to a team. This can be useful in team management decisions, such as scouting, deciding which players to roster, and contract negotiations.
Analytics can also be used in team strategy decisions. Metrics such as expected goals can be used to determine line combinations for different scenarios. An example of analytics affecting a team’s strategy is that teams are pulling their goalie an average of 24 seconds earlier in 2021 compared to the 2013-14 season. Seattle Kraken head coach Dave Hakstol credits this change to a heavier reliance on analytics [8].
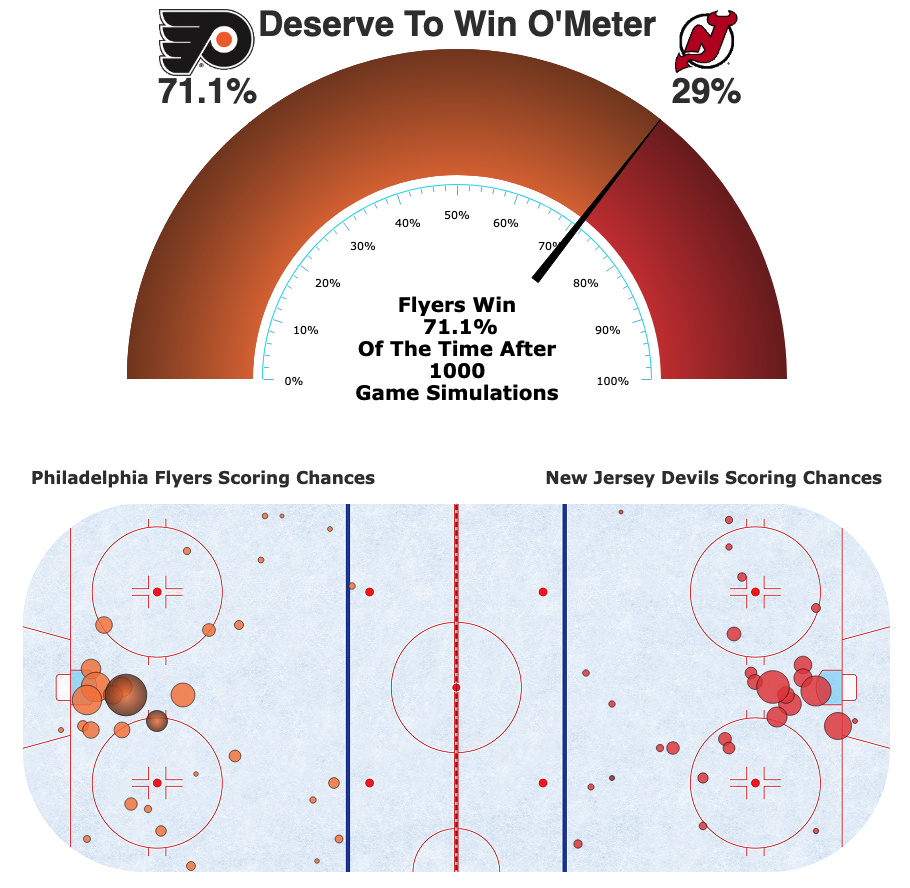
There are also fan implications. Advanced analytics metrics are consistently being discussed during broadcasts, enhancing fan engagement and understanding of the sport. Moneypuck’s “Deserve To Win O’Meter” Figure 2 is a fun graphical way to show which team “deserved” to win the game, regardless of the actual score based on expected goals. It’s interesting that teams that finish the game at above 50% on the meter have historically won 64% of games [9].
Results and Limitations
Due to the high degree of randomness in sports, specifically in hockey, there are some concerns and limitations about the effectiveness of advanced analytics. For example, moneypuck’s game prediction model states that “For the 2023-2024 regular season, the team the pre-game model had as the favorite won 61.1% of games. The model’s log loss was 0.661” [9]. While better than picking randomly, an accuracy score of 61% does not induce confidence in any given prediction. One example of public opinion turning against sports analytics is when the Tampa Bay Rays (MLB) pulled their pitcher while he was in the midst of a no-hitter. This was an analytics-based decision, and was largely criticized [10].
Another limitation is the public availability of high quality data. NHL team in-house data is often tightly guarded and not shared with the public. This is evidenced by Winnipeg Jets head coach Paul Maurice criticizing public analytical models, stating that the public analytics did not match the Jets in-house models [11].
Technologies
If you are interested in working in hockey analytics, it’s important to be skilled in programming/software, data analysis and statistical techniques, and presentation. Hockey specific domain knowledge can also be a valuable asset.
Most analytical tools are built with programming languages Python, R, and SQL. It is also important to understand key Python libraries, such as Pandas (data manipulation), NumPy (numerical computation), Matplotlib/Seaborn/Altair (data visualization), and scikit-learn (machine learning).
It is also important to have a solid understanding of data analysis and statistical techniques. Statistical concepts including distributions, regression analysis, hypothesis testing, and correlation are crucial for analyzing player performance and game data. Machine learning techniques, such as decision trees, random forests, and neural networks are very useful for predictive modelling.
A critical but underestimated skill is data visualization and storytelling. The usefulness of the most complex analysis can be very limited if it is not translated into insights that are accessible and understandable for non-technical audiences, which include the main consumers of hockey analytics data (coaches, broadcasters, fans).
Resources
Hockey analytics is continuously innovating and growing. Some analytical tools are publicly available:
- https://www.naturalstattrick.com
- https://www.moneypuck.com
- https://evolving-hockey.com/
- https://hockeyviz.com
- https://hockeyprospecting.com
- https://eprinkside.com
- https://www.allthreezones.com
- https://public.tableau.com/app/profile/topdownhockey/vizzes
- Twitter community (@jfresh, @domluszczyszyn, etc.)
There are also many useful sources of raw data, including:
- https://moneypuck.com/data.htm
- https://www.nhl.com/stats/
- https://edge.nhl.com/en/home
- https://www.hockey-reference.com/
Summary and Final Thoughts
- Hockey analytics is the process of analyzing hockey players and teams through the use of statistics, machine learning, and other tools, to gain a greater understanding of the effects of their performance.
- Key metrics include Corsi, Fenwick, PDO, Expected Goals, Goals Saved Above Expected, and Wins Above Replacement.
- Advanced analytics can be applied in player evaluation, team strategy, and fan engagement.
- Concerns and limitations about the use of analytics in hockey include lack of model accuracy and lack of high quality data.
- Important technological skills in hockey analytics include programming/software skills, data analysis and statistical techniques, domain specific knowledge, and presentation skills.